A Bioinformatic Approach to the Clinical Evaluation of Hematopoiesis Models using Blood Cell Count Data from Patients Enrolled in Clinical Trials of Plinabulin
The following case study features data presented at the 64th Annual Meeting of the American Society of Hematology.
Background and Study Aim
There are two major hypotheses for the mechanisms of hematopoietic stem cell (HSC) specification. The first is the Lineage Commitment model, whereby differentiation of blood cells is believed to occur in a stepwise manner down a pre-defined hierarchy, with hematopoietic progenitors unable to return to a more primitive state once committed to a lineage. The second is the Continuum of LOw-primed UnDifferentiated (CLOUD) model, which hypothesises that HSCs acquire biases towards certain lineages over time with single-lineage progenitors emerging from this continuum, and that the intermediate progenitor cells of the classical hierarchy do not exist as discrete populations (Velten, Nat Cell Biol 2017). Evidence for the two models has been derived mainly using in vitro methods. Therefore, we do not currently have in vivo clinical data with which to study hematopoiesis without analytical method-induced ‘bias’.
Plinabulin is a novel selective immunomodulating microtubule-binding agent. It prevents chemotherapy-induced-neutropenia in cancer patients receiving myelosuppressive chemotherapy (chemo). Researchers at BeyondSpring Pharmaceuticals hypothesised that plinabulin could serve as a pharmacological interventional approach to evaluate models of Linear Commitment versus CLOUD for hematopoiesis in an in-vivo, human setting. To test this hypothesis, peripheral blood cell (PBC) counts from the myeloid, lymphoid, and erythroid lineages in cancer patients receiving chemo with and without plin were analysed using bioinformatics approaches. Fios Genomics conducted the required bioinformatics analyses.
Experimental Design and Data Analysis
Researchers at BeyondSpring Pharmaceuticals collected PBC counts from cancer patients (Breast, NSCLC, HRPC) receiving chemo with plinabulin doses of 5, 10, 20 or, 30 mg/m2 (or equivalent) or placebo (without plinabulin). In cycle (C) 1, all patients (with and without plinabulin) had received 16 mg dexamethasone at day (D) -1, D1, and D2 as premedication for docetaxel or TAC. Plin was given as a single dose by 30 min IV infusion 30 mins after (the last) chemo on D1. Samples were collected for analysis at screening (C1D-1, pre-dexamethasone), predose (C1D1) and at 24 hours after chemo with or without plin (C1D2).
Blood draws for absolute counts of PBCs, segmented neutrophil (N), band neutrophil (BAND), monocyte (M), eosinophil (E), basophil (B), lymphocyte (L), erythrocyte (RBC), platelet (P), and immature cells, were analysed by Central Laboratory (LabCorp). Fios Genomics then performed bioinformatic analysis. To detect treatment-specific effects on the structure of the cell count data across samples, Fios Genomics conducted exploratory Principal Component Analysis (PCA) and Pearson correlation analysis. We performed linear modelling using Limma to assess treatment impact on cell counts (C1D1 vs screening; C1D2 vs C1D1) and to assess association of changes in cell counts (screening to C1D1; C1D1 to C1D2) with treatment group, adjusting for relevant clinical variables. Significant differences were defined as those with a P-value adjusted for multiple testing of P < 0.05. In order to evaluate correlations between cell types in the change in cell abundance from C1D1 to C1D2 across patients in the plinabulin and placebo arms, we performed further correlation and clustering analyses, and evaluated results in the context of the classical hematopoietic hierarchy (with focus on relationships between MEP, GMP, and GLP lineage cells).
Results
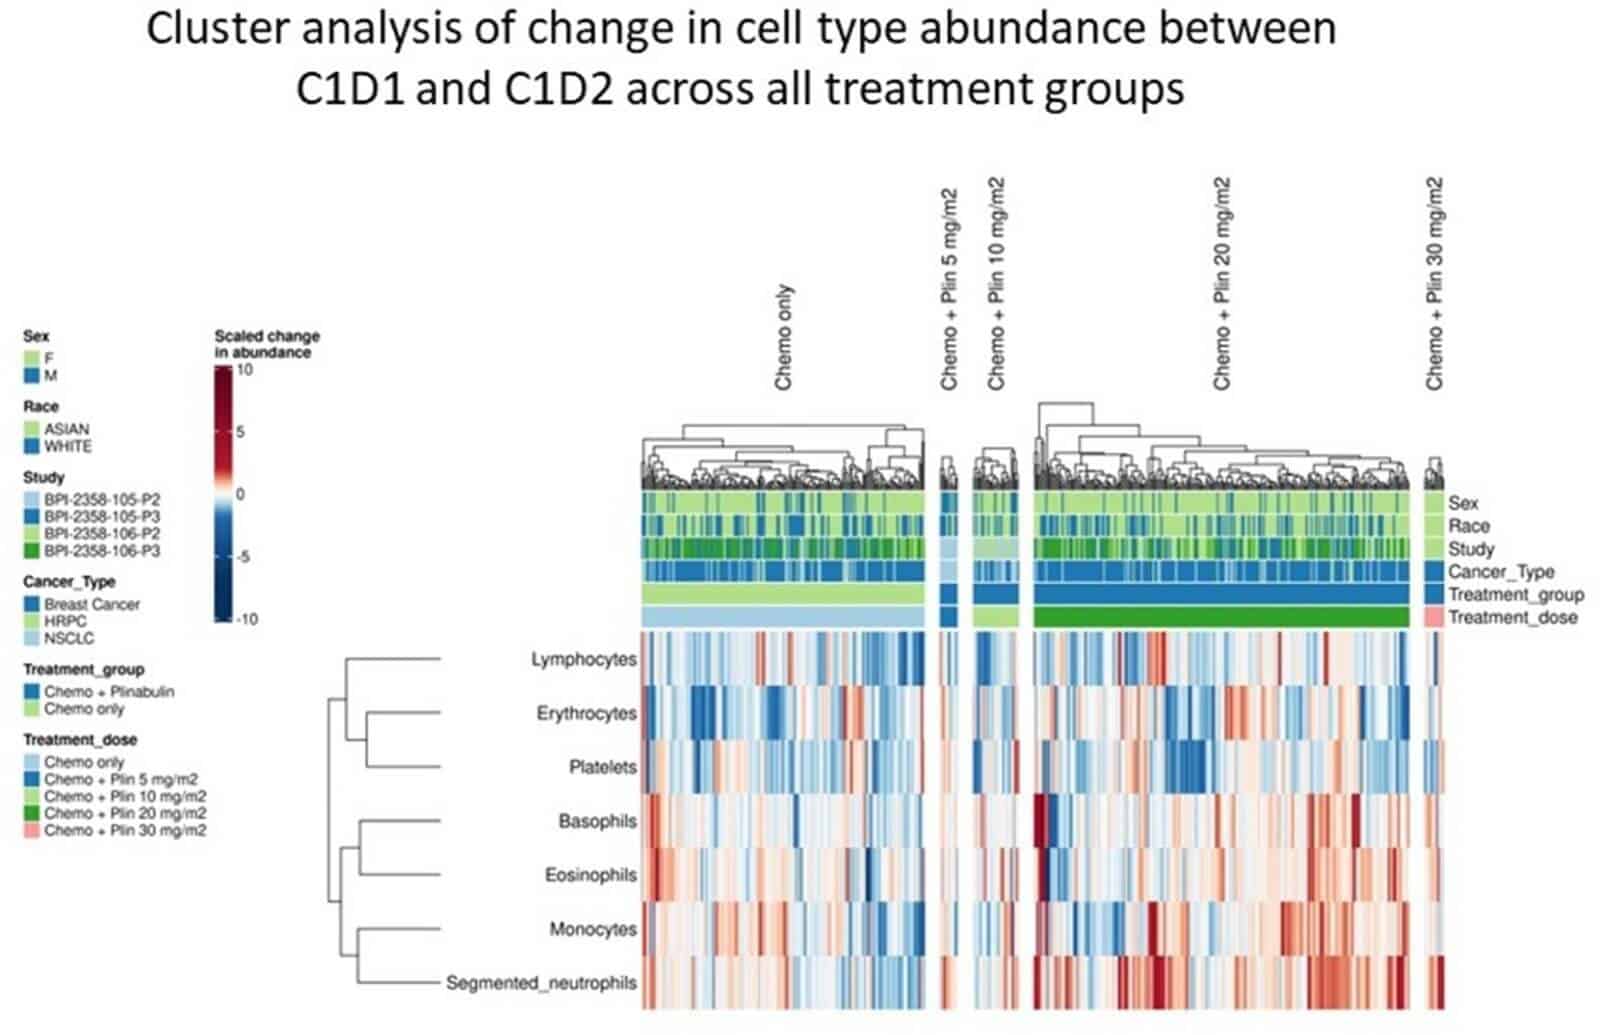
Following treatment with chemo and plinabulin placebo, cell types from lymphoid, myeloid and erythroid lineages demonstrated significantly decreased abundance at C1D2 vs C1D1, reflecting myelosuppression by chemo. In contrast, following chemo and plinabulin combination, researchers observed an increase in abundance for all GMP-derived myeloid cells (N, M, B, and E) in a plinabulin dose-dependent manner. These GMP-derived myeloid cells significantly increased in absolute count following treatment with plinabulin at C1D2 vs C1D1, which suggests not only protection, but also stimulation of GMP cells by plin. Additionally, significant increases at C1D2 vs C1D1 in immature post-GMP progenitor cells (BAND, metamyelocytes, and myelocytes), were observed with plin, but not with placebo. This further supports GMP stimulation by plin. For CLP- and MEP-derived cells, there were decreases seen with plinabulin, though to a much smaller extent compared to placebo, suggesting a degree of protection with plinabulin. Cell cluster analysis, shown in Figure 1 below, showed inter-correlation in change in abundance of GMP-derived cell types (N, M, B, and E), supporting the lineage commitment model. Relative abundance in cells derived from the CLP and MEP lineages were also intercorrelated, further supporting Lineage Commitment.
Figure 1
Conclusion
Bioinformatic analyses showed that plinabulin not only has protective, but also stimulatory effects on GMP cells under myelosuppressive conditions. The increase in abundance of immature PBCs derived from the GMPs further supports stimulation of GMP cells with plinabulin. Additionally, the data also suggest a degree of protection by plinabulin on CLP-and MEP-derived cells. The interdependence in abundance of mature PBCs derived from GMP cells and CLP- and MEP-derived cells is supportive of the lineage commitment hypothesis.
