Hints and Tips To Improve Your Bioinformatics Skills
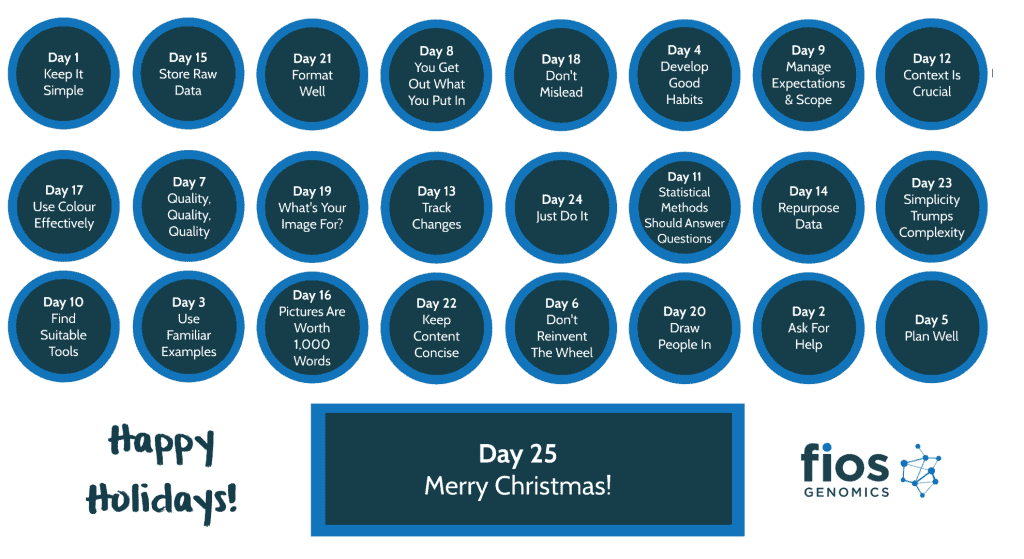
Over December, we published hints and tips for improving bioinformatics skills on our social media pages. From how important data quality is in analyses to getting into good habits early on, which tip do you find the most helpful?
1. Keep It Simple
If you’re just starting to get into bioinformatics, keep it simple. Set a few, straightforward goals then focus on them. Don’t get side-tracked or try and do too much in one go.
2. Ask For Help
There are many resources out there to help with bioinformatics questions. Whether you start with online forums or speak to knowledgeable colleagues, you can find support for language-specific or broader technical application queries.
3. Use Familiar Examples
“Familiarity breeds relevance.”
When learning new concepts or putting new tools into action, try and find examples to use that you’re more familiar with. It’s easier to learn and improve your bioinformatics skills when you can relate the research to yourself.
4. Develop Good Habits
Starting with good practice saves time in the long run. By ensuring you have good documentation, it will make you and your code more efficient, and will help enhance reproducibility.
5. Plan Well
Think carefully from the outset about what you want to gain from your data analysis, then keep those aims in mind during the design and execution stages of your experiments.
A well planned and performed experiment maximises the chances of being able to accurately and confidently draw the conclusions that you want.
6. Don’t Reinvent The Wheel
Whether you’re starting a new project or have got stuck in a current one, see what methods are already out there before you dive in to creating a new one. GitHub and SourceForge are huge software repositories – and could save you time and offer coding support!
7. Quality, Quality, Quality
We can’t stress this enough – quality is important at every stage of research. From the quality of data generated, to the quality control completed as part of a standard bioinformatics pipeline. It becomes even more important when public datasets are used and integrated into analyses.
8. You Get Out What You Put In
If the data you use is of bad quality, then what does that mean for your bioinformatics analysis? Downstream quality control can only do so much when experimental design causes quality issues.

9. Manage Scope And Expectations
Scope-creep, scope-grope and scope-swell are all major challenges for bioinformatics projects. Deciding on a Statistical Analysis Plan from the beginning ensures that the scope is manageable – with no sudden or significant expansions and resources aren’t wasted – while expectations for analysis are understood.
10. Find Suitable Tools
The ideal bioinformatics analysis is reproducible as well as reusable. To do that, the tools you use are key. There are a number of factors to take into account: if it’s a widely used tool, supported by developers, opensource, version controlled, easily installable… Work out criteria for deciding on new tools for use.
11. Statistical Methods Should Answer Questions
What’s the goal for your research? What underlying questions come out of your generated data? Answering the scientific question of your research, and not just applying one method to a data type, can help find underlying patterns in your data.
12. Context Is Crucial
Bioinformatics sits at the centre of Biology, Statistics, and Computer Science. The scientific context behind research is obviously important, and having conclusions that are data-driven and led by biology rather than statistics helps place research in its wider setting.
13. Track Changes
Tracking your changes helps to ensure quality control during data analysis. It also allows your research to be reproducible, as workflows change over time and tracking allows for verification and validation of changes.
14. Repurpose Data
Whether it’s from data you’ve previously generated or data that’s in public databases, there is always further information to be gained from datasets. In drug development, data from trials can help inform how a drug could be repurposed in the future.
15. Store Raw Data
There are a number of benefits to storing the raw data behind figures. It allows you to make modifications quickly (whether small tweaks or larger plotting updates), as well as go back to previously created figures to ensure ongoing consistency. Additionally, storing the code used to make a figure is also very useful!
16. Pictures Are Worth a Thousand Words
We’ve all heard it before, but pictures certainly are worth a thousand words. Whether it’s graphics for a poster, report, or paper, they are key in helping you effectively communicate the findings to others, who can then understand the results.
17. Use Colour Effectively
A colourful scientific figure can highlight specific features or visually show differences – but don’t overdo it. Be careful with too similar colours, or just using colour for the sake of it!

18. Don’t Mislead
Keep your figures clear and simple. Use plots and graphs that convey your data in the simplest form – and keep their meaning clear for the reader. If you are creating a series of figures, then keep your colour scales and axes consistent throughout.
19. What’s Your Image For?
What figures work for a scientific article will not be the same as those that work for presentations. Presentations need clear, uncluttered images that tell a simple story. Scientific articles, on the other hand, can have more complex, detailed images that the readers can dive into.
20. Draw People In
Don’t judge a book by its cover – or a scientific presentation by its title. There is an art to getting the length and hook of a presentation or article title right, but make sure your topic is still clear.
21. Format Well
Good formatting and layout for posters and slides helps you to communicate your results – whist ensuring that the audience can actually make sense of them! Having legible text and a clear layout helps readers to move logically through your research without too much detail adding confusion.
22. Keep Content Concise
It can be hard to distil all your results down into a clear and concise summary sometimes, especially when constrained to a poster or slide. Clear wording and well-placed figures will let your story be heard and demonstrate your bioinformatics skills without losing your audience’s interest.
23. Simplicity Trumps Complexity
Start with basic, simple approaches then add complexity to your analyses as it’s needed. Often for larger bioinformatics projects, there is inherent complexity to the analyses and intricate models are required – but don’t assume all projects need the same level of complexity.
24. Just Do It
Finally, our message is to just get started. The first step is the hardest, and making mistakes whilst programming is all part of the learning curve! Just start and you will improve your bioinformatics skills as you progress.

Find out more about our work
Interested in finding out more about how Fios can help your research? Our Services page contains more information on the areas we work in, the types of data we often analyse, as well as how we can add value to your research.

