Bulk RNA-Sequencing Analysis Using FGEz
- 30th July 2025
- Posted by: Breige McBride
- Categories: Bioinformatics, Sequencing
Bulk RNA-sequencing analysis is a widely-used and vital tool for biological research. However, researchers are often faced with the challenge of handling the downstream data analysis once sequencing is complete. At Fios Genomics, we have developed the FGEz pipeline to handle RNA-sequencing data analysis, which includes a series of automated steps and, critically, manual validation and evaluation steps. Our FGEz pipeline includes steps such as quality control & preprocessing of count data, differential expression analysis (DEA) and functional enrichment analysis. We utilise open-source bioinformatics tools, such as EdgeR and Limma, to provide a comprehensive and flexible analysis workflow to handle either simple or complex data sets.
By comparison, there are many web-based tools which claim to offer free and easy DEA analysis with limited user input. In the following blog post, we have compared our FGEz pipeline to various open-source web platforms to assess how these tools performed when given a complex data set with known batch issues. We identified a publicly available data set, GSE173078, with confirmed batch effects. The raw read counts data are hosted on Gene Expression Omnibus (GEO), a repository of data collected from high throughput studies. The original study aimed to investigate gene expression changes involved in progressive gum disease. They therefore sequenced gingival tissue from patients with healthy gums, gingivitis or periodontitis for DEA (Kim et al., 2021, Periodontology).
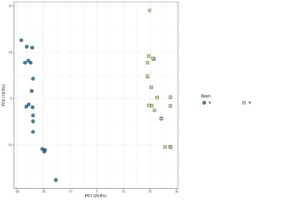
Figure 1:
We chose three online tools for comparison, namely GEO2R, GENAVi and ExpressAnalyst. GEO2R is an online platform provided by the GEO database, offering basic DEA and visualisation. As the data set was already hosted on GEO, it could be easily loaded and analysed by providing the data set accession number. By comparison, GENAVi and ExpressAnalyst offer a more comprehensive and flexible workflow, such as different normalisation techniques or DEA tools and functional analysis.
After conducting the comparison, it was clear to see the appeal of using an online and free platform for DEA and functional enrichment analysis. The web tools are generally easy to use and generate results tables or figures with a few clicks. They offer data visualisations and conduct the majority of preprocessing steps required for analysis. They also allow you to download the results and figures for further use. The actual DEA results from each tool differed across platforms and were model dependent, though the results from ExpressAnalyst and GENAVi workflow were comparable to our FGEz results.
Despite this, all of the automated tools provided results which contained major flaws in one or more of the following five areas:
1. Flexibility
The three tools tested displayed varying levels of analytical flexibility, though GEO2R only permitted analysis of data sets already hosted on the GEO platform. Other than this restriction, the three tools all included a level of data QC, normalisation and DEA of the uploaded data set.
Firstly, all web-based tools include preprocessing steps to remove genes with low expression from the data set. This allows us to remove noise from the data and reduce the number of tests performed during association testing by filtering out genes with low or no expression. However, both GEO2R and GENAVi do not allow the user to modify this step. All three tools failed to implement the filtering step within the dependent variable group, which in this case is disease status. It is important that we can distinguish between genes that universally have low expression across samples, and those that report low expression within an experimental group. Without this step, we risk removing any true biological differences between groups, which in this case may be driven by disease status.
The online tools also performed data visualisation as part of data QC, including principal component analysis (PCA). This method of dimensional reduction and visualisation permits the identification of potential unwanted technical or biological effects which may be associated with variation in the data. From our FGEz analysis, we knew that “Batch” was driving the segregation of samples in the PCA (Figure 1). ExpressAnalyst and GENAVi provide PCA visualisations, however, only GENAVi possesses functionality to determine the cause of this variation. Using this tool, we were able to overlay the metadata variables with the PCA plot to identify “Batch” as the cause of the grouping. Without this knowledge, we run the risk of incorrectly modelling our data during DEA and drawing false conclusions. Overall, GEO2R and Express Analyst both fail to identify the batch issues in the data set, which is a major drawback to using the two platforms.
Figure 2A) GENAVi
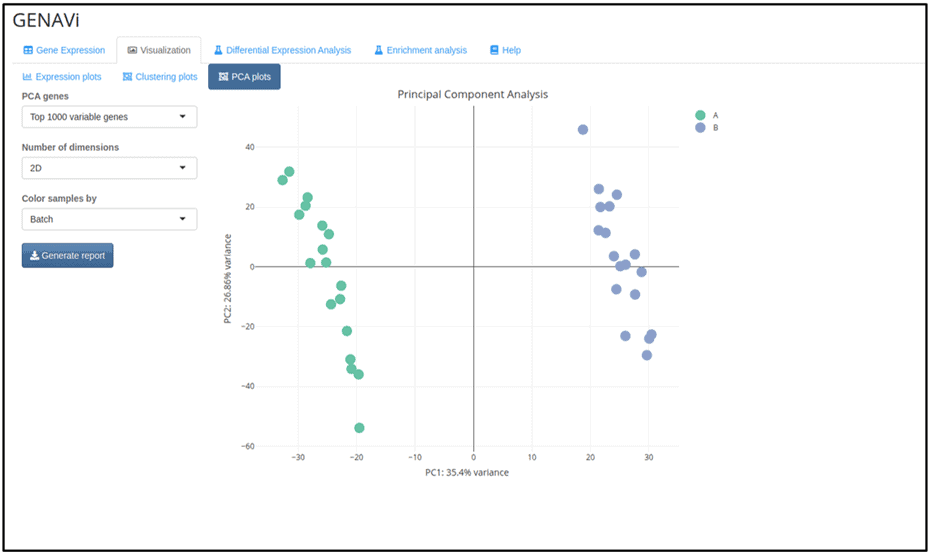
Figure 2B) ExpressAnalyst
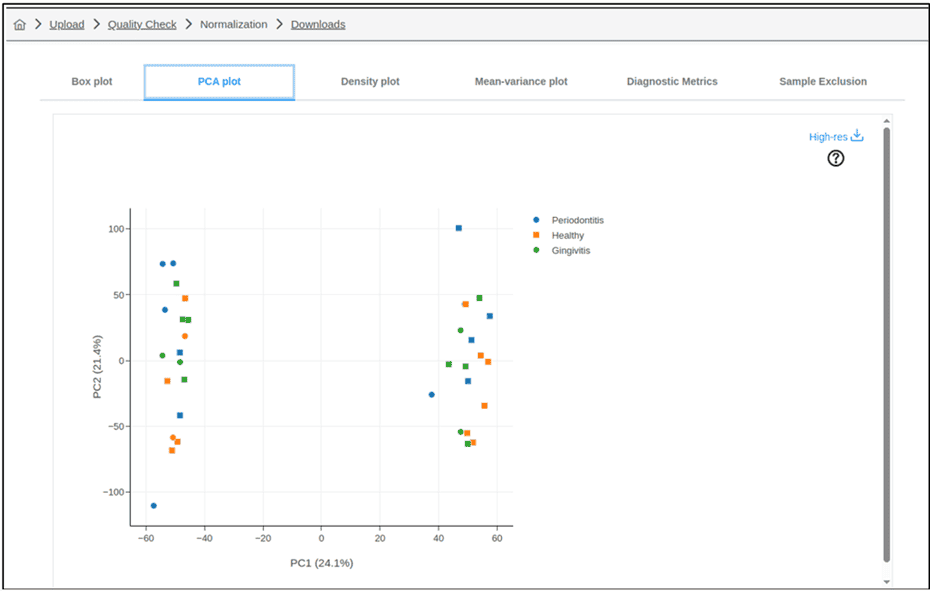
Figures 2A and 2B : Results of principal component analysis (PCA) performed using A) GENAVi and B) Express Analyst: Both GENAVi and ExpressAnalyst performed PCA for the identification of variation in the data. While both plots clearly show that the samples separate into two groups along PC1, only GENAVi permits the user to colour the samples according to variables such as Batch (Figure 2A). As such, GENAVi allows the user to identify sources of variation which must be considered during downstream analysis. Note that GEO2R does not provide the option to generate a PCA plot.
In addition, GEO2R only provides a single option for normalisation of the data. In comparison, ExpressAnalyst offers multiple methods, but the same method is used for both visualisation and downstream analysis. These are significant limitations to the tools, as different normalisation methods are appropriate for visualisation versus DEA.
In our FGEz analysis, rlog normalised RNA-seq counts were used to visualise the data during QC. This method of normalisation ensures that genes with low expression do not dominate the results and, therefore, helps highlight outliers in the data. We then performed TMM normalisation, the preferred method for Limma, on the raw counts prior to DEA. Only GENAVi provided different options for normalisation, visualisation and DEA.
Furthermore, GEO2R and GENAVi both implement DEA using DESeq2. In comparison, ExpressAnalyst allows the user to choose between DESeq2, EdgeR and Limma. The choice of tool for DEA must consider factors such as the experimental design, results of data QC and the contrasts of interest. Therefore, the lack of flexibility can again detrimentally impact upon the validity of the results if an inappropriate method is used.
Figure 3:
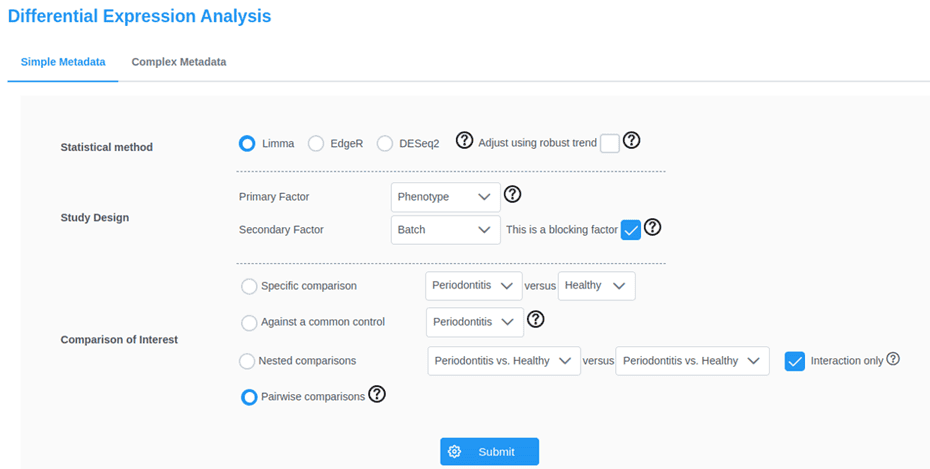
2. Statistical understanding and coding experience
Despite the importance of flexibility in the choice of online tool, increased flexibility requires the user to have a level of statistical understanding to inform their decision making. Statistical understanding is also relevant for critically comparing online tools and identifying potential issues in the workflow which could invalidate results. An additional problem is that many of these tools do not have extensive technical support or information to guide their use beyond the basics. Instructions on use do not delve into the nuances of analysing complex data sets, where confounding and covariates may need to be considered.
A specific example of this issue is seen when performing DEA using ExpressAnalyst. The tool allows the user to include covariates in the analysis and conduct a wide range of contrasts, including time series and nested comparisons between contrasts. However, deciding upon the correct model to use requires statistical knowledge and the tools lack the transparency required to fully understand the underlying processes.
Furthermore, these tools often require the data to be saved in a particular file format and the files to be structured in a particular way. The most involved example of this was ExpressAnalyst, where columns were expected in a certain order with predetermined names. RNAseq data sets can often be too large to open using spreadsheet software. Using such tools can also result in the introduction of formatting or copy-paste errors, such as gene-to-date conversions. With these issues in mind, it is easier to produce the correctly formatted data within a coding environment, which again, requires the user to have a degree of coding experience.
Figure 4A)

Figure 4B)

Figures 4A and 4B : Input data format for ExpressAnalyst: The user is required to format their input data according to match the specific format required by the tool. As counts files are often very large; these can be most easily formatted within a coding environment. Therefore, the tools require some data preparation, which requires the user to have coding experience.
3. Transparency
In general, data analysis steps are hidden behind buttons using the automated tools. While this makes the platforms easy to use, it removes the user’s ability to interrogate the analytical decisions taken by the tool. The platforms do provide access to the code being run and/or the source code via Github. However, as previously discussed, understanding the raw code requires a level of coding and statistical understanding.
Despite this, the tools which offered the greatest flexibility, namely ExpressAnalyst and GENAVi, were also the most transparent regarding their analytical steps. The ability for the user to decide thresholds, models and tools reduced the number of hidden steps and provided clarity to the workflow.
4. Performance
The tools are easy and quick to use for relatively small data sets but often come with warnings about online use when data sets become too large. Some of the tools offer local, downloadable versions of the platform or the ability to run the software using docker. With this, you lose the benefits of a portable, online analytical tool and require some computational understanding for local installation/runs of the software.
Functional analysis performance was relatively poor for both ExpressAnalyst and GENAVi. This step handles very large amounts of data, due to the vast number of pathways and gene ontologies available. In particular, ExpressAnalyst was often slow to use practically and frequently failed. For both tools, the user had to run the analysis individually for each DEA contrast performed and save the results between runs to retain the information. In addition, the user was limited to the default ontology databases hosted on the website, though there were opportunities to provide your own.
Finally, as these tools are all online, they may fall prey to server outages. Unfortunately, the progress of a project is not saved in cases where the server crashes or there is a loss of internet connection. Performing the analysis within a coding environment allows you to save intermediate files and avoid this problem.
5. Interpretability
The online tools output a considerable amount of information, including statistical tests, tables and visualisations. However, these platforms lack any interpretation to apply the results in a wider biological or statistical context.
The analysis team at Fios Genomics have biological and statistical backgrounds that allow thorough interrogation of the analysis and results. We can identify any limitations of the study, such as those pertaining to statistical power or study design. The online tools simply process the data and output results, which must then be interpreted by the user. They are unable to identify issues in the data or modelling which may cause the results to be questioned. This responsibility falls upon the user and again relies on statistical understanding.
Figure 5:

Conclusions
Overall, the three online tools tested offer varying degrees of statistical analysis and visualisation for bulk RNA-seq data sets. GENAVi and ExpressAnalyst were the most comprehensive but at times lacked flexibility or failed to address all batch concerns. None of the tools offered the same comprehensive analysis that is performed by our FGEz pipeline. The greatest benefit to our pipeline is the human input we provide, namely the involvement of a team of analysts with biological or statistical backgrounds. This allows us to interrogate the data thoroughly, choose appropriate tools for the data set and provide valuable interpretation of the results. In their current iteration, these tools fall short of providing an equivalent or better analysis than the FGEz pipeline.
If you have a bulk RNA-seq analysis project you would like to discuss, please contact us, we will be happy to help.
Author: Divya Pandya, Senior Bioinformatician, Fios Genomics
See Also:
Single-Cell vs Bulk RNA Sequencing
