Transcriptome analysis of antigen-specific Teff responses
This case study showcases the work of Charles River Laboratories and Fios Genomics on behalf of a pharmaceutical client. The study involved transcriptome analysis of isolated antigen-specific CD8+ T cells from patients with different immunological conditions, following stimulation with pools of viral antigens, autoantigens or allergens. These peptide pools activate and expand autoreactive or allergen-specific T cell clones within the total T cell pool to enable characterization of the disease-associated profile, and allow a comparison to protective anti-viral responses. Bioinformatics analysis was performed by Fios Genomics.
Image A, below, details the steps from antigen-specific CD8+ T cell isolation to bioinformatics analysis.
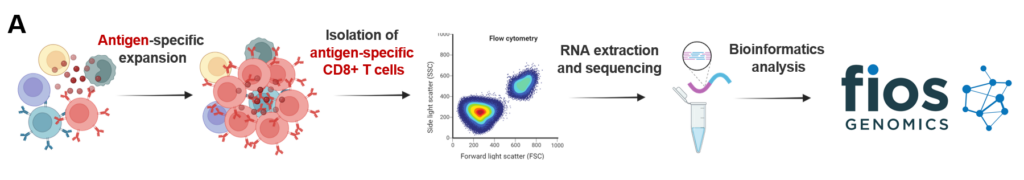
PBMCs were stimulated with viral, autoantigen or allergen peptide pools for seven days. CD8+ T cells were then sorted and subjected to RNA extraction and RNA sequencing. Fios Genomics then conducted RNA-seq analysis on post treatment samples and compared gene expression between the vehicle control and the three stimulation groups, stratified by patient condition, to identify key differences.
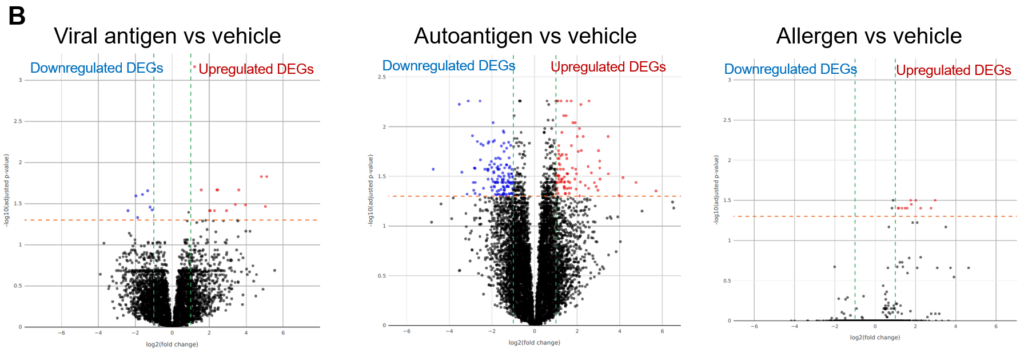
In image B, below, we can see volcano plots showing significance (as -log10 transformed P-values) against magnitude (log2(fold change)). Differentially expressed genes (DEGs) are represented as red (up-regulated) or blue (down-regulated) dots. The vertical green and horizontal orange lines represent the fold change and P-value thresholds applied, respectively.
Finally, image C shows Reactome analysis highlighting the functional networks that are differentially up- or down-regulated across different antigen-specific stimulations.
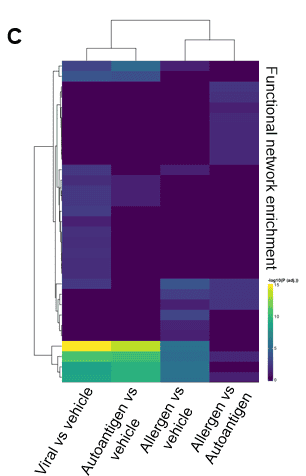
In conclusion, Fios Genomics’ differential gene expression analysis between patient group and stimulation conditions, identified a large number of DEGs across multiple contrasts, which mapped to biological pathways relating to immune cell function and lipid metabolism, highlighting key differences in the responses to distinct antigens.
Note: the results presented are a snapshot of those used to draw the above conclusions.
