Understanding and Analysing Flow Cytometry Data
Whether you are looking to learn more about cancer cells or microscopic parasites, Flow Cytometry is a cell analysis technique that can help.
What is Flow Cytometry?
Cytometry is concerned with the measurement of cell characteristics such as cell size, cell cycle and cell count. There are various laboratory applications and techniques which utilise cytometry in different ways, including Magnetic Twisting Cytometry, Mass Cytometry and Flow Cytometry, the focus of this article.
Flow cytometry is an application used for detecting, identifying, and counting specific cells. Flow cytometrists can also use this application to check for the presence of different protein markers, known as antigens, on or within a cell to differentiate between cells.
How Does Flow Cytometry Work?
In a flow cytometer, cells suspended in liquid flow in single file past a laser. This produces light-scatters for each cell, allowing different cells types to be detected, identified, and counted. The light-scatters produced are Forward Scatter (FSC) and Side Scatter (SSC). FSC relates to cell size while SSC relates to cell granularity.
What is the Difference Between Flow Cytometry and FACS?
All output from a flow cytometer is data. Flow cytometry should therefore not be confused with Fluorescence Activated Cell Sorting (FACS) which facilitates the collection of specific cells.
Understanding & Analysing Flow Cytometry Data
Flow cytometry data depicts each cell as one dot. The dots are depicted on flow figures such as contour plots, histograms, pseudocolour plots and dot plots. The first plot produced commonly has FSC as the X axis and SSC as the Y axis.
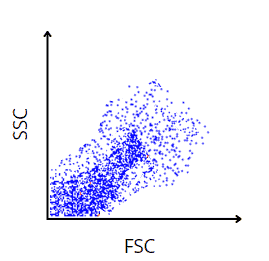
(This image is purely for illustrative purposes and has not been created using flow cytometry data)
To analyse the data contained in flow figures a process called ‘gating’ is used, to isolate specific cell types. Gating works by selecting only the cells which meet the criteria being gated for. For example, once debris has been eliminated, the first stage of gating is often ‘doublet discrimination’ which isolates only single cells to be gated, so that doublets remain outside the gate.
(Learn more about flow cytometry gating strategies)
Once gating has been used to identify the specific cells of interest, a process called ‘backgating’ can be used. Backgating is where cells identified via the gating process are then plotted on a dot plot with different parameters, for instance on the original flow figure which depicted FSC and SSC. This would give an indication of the size and granularity of the cells of interest in relation to the other cells within the original sample.
Drawing Conclusions From Flow Cytometry Data Analysis
As you will now understand, flow cytometry produces large volumes of data which can be analysed via the gating process. However, drawing actionable conclusions from flow cytometry data can be a complex and time-consuming process involving the application of bioinformatics. At Fios Genomics, our bioinformaticians have extensive experience scrutinizing flow cytometry data to produce clear and actionable conclusions to improve patient outcomes. We can provide support throughout the entire research journey including discovery, quality-control and independent verification.
To learn more about our flow cytometry services please contact us.
Author: Breige McBride, Content and Social Media Manager, Fios Genomics
Reviewed by Fios Genomics Bioinformatics Experts to ensure accuracy
You may also be interested in:
Collaboration between G1 Therapeutics and Fios Genomics (See ‘ESMO Congress’ section for details of flow cytometry data analysis provided by Fios Genomics).
