Common steps in Single-Cell RNA-Seq data analysis
- 11th August 2022
- Posted by: Claudine Gabriele
- Category: Single Cell Analysis

Before diving into a typical workflow for single-cell RNA sequencing (RNA-Seq) data analysis, we will examine the benefits of single-cell RNA-Seq and what the computational challenges are when analysing these datasets.
Thanks to single-cell RNA-Seq, we can measure the expression of genes in individual cells, and therefore grasp the heterogeneity of cell populations, and find gene expression signatures of these populations, or biomarkers.
We can also see how different cell types interact with one another and identify the differences in cell-type composition between different individuals or conditions.
What are the challenges in Single-Cell RNA-Seq data analysis?
There are some computational challenges that we need to keep in mind when selecting the right method for analysing these datasets. We have included some of these challenges below:
- Multiplets – some single-cell RNA sequencing experiments might generate multiplet errors when labelling multiple cells with the same barcode. This happens often with droplet-based methods where it is common that cells fit with each other and get the same cell barcode. These libraries, therefore, do not represent “single cells” and only show an average expression across all the cells of the multiplet. Methods to automate the detection of multiplets do exist. However, these tend to overestimate the number of multiples. This is why we filter multiplets using a manual threshold on the total number of genes detected per cell
- Sparsity of the data – when analysing single-cell RNA-Seq data we need to consider that these consist of more than 80% zero values. This is because not all genes are present in all cells. Additionally, there are dropouts: this means that even though a gene is expressed in the cell, we were unable to capture and measure it
- Overdispersion – gene expression varies significantly across all the cells, even between cells of the same cell type. Stochastic effects are mainly the cause of this
- Batch effects – we need to take batch effects into consideration, especially when wanting to integrate multiple datasets coming from different individuals or conditions or timepoints
- Data size – the size of single-cell RNA-sequencing continues to grow, aided by the ever-increasing availability of high-throughput methods.
Main steps of an analysis workflow for Single-Cell RNA-Seq data
Single-Cell RNA-Seq data analysis can entail different steps, depending on the purpose of the analysis. Here, we include the main steps of a Single-Cell RNA-Seq data analysis workflow.
Need help with any of the steps below?
Quality Control (QC)
The first thing we want to do before the analysis of single-cell RNA-Seq data is to check the cells’ quality. We will then remove low-quality cells and any multiplets.
In order to determine the quality of the cells, we normally examine the number of detected genes for each of them. We also look at the number of detected housekeeping genes per cell that we know should be expressed in all cells regardless of the cell type. We also examine the percentage of the mitochondrial genes. A high percentage of these genes induced stress during sample preparation and these cells should be removed prior to downstream analysis. An additional step might be to remove noisy genes. However, this is not a mandatory step and might not be useful in some cases.
Clustering
After removing all multiplets and low-quality cells, we can proceed with clustering the cells. We do so to understand the structure of the data.
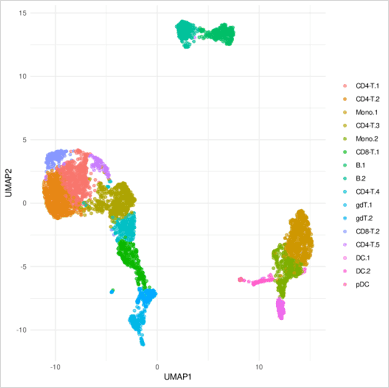
Since the data is high-dimensional we start with selecting informative features. These usually consist of highly variable genes as they can possibly capture most of the variation in our data. We then use these genes to reduce the dimensions of the data, using usually Principal Components Analysis (PCA) or Independent Components Analysis (ICA). We can then cluster the cells based on the distance from each other in this lower dimensional space.
Finally, we can project the cells in two dimensions and visualise their clusters. In the example below, we can see human Peripheral Blood Mononuclear Cells (PBMCs) from a single healthy donor. Each dot represents a cell whose colour matches the relevant cluster identity identified during clustering.

Cluster QC
It is important to ensure that the clustering is correct. This is why at this stage it is crucial that we check what is the clustering driven by. More specifically, we need to identify if it is a technical variation or biological variation driving the clustering. The clustering should not be influenced by the quality of the cells but by biological characteristics. It is also important to assess that the clustering of the cells is not driven by any biological variation that is not relevant to the study. For example, the cell cycle.
Cell type annotation
Lastly, we want to ensure that clustering reflects what we already know about the cell population biology expected in our samples. We can do this by checking the expression of known biomarkers and whether they are enriched in some of our clusters. We can also use these markers for manual cell type annotation of clusters we identified, if it is not possible to use any automated method.
Differential gene expression analysis
To better understand the groups of cells that we have identified, and identify subtypes or altered states of known subtypes, we can do differential gene expression analysis. This will help to find the gene signatures or biomarkers of these populations. Ultimately, it will also help to understand the function of these cells. With differential gene expression analysis, we can compare cells of a cluster with all the other cells. This is to see what the main gene signature of that population is. Furthermore, we can compare subtypes of major cell types to identify more subtle differences between transcriptionally similar cell populations.
Benefits of Single-Cell RNA-Seq data
In conclusion, single-cell RNA-Seq data enable researchers to:
- understand the heterogeneity of samples, which is masked by bulk-RNA sequencing.
- identify gene signatures and biomarkers to define cell subtypes and states of cell subtypes and understand their functions
- identify how equivalent cell populations change across different individuals, timepoints, or conditions in terms of their transcriptional patterns and their prevalence.
There are many established methods and tools to analyse single-cell RNA-Seq data. However, there is no single tool that can fit all data. We need to understand the biological and technical features of our data to select the appropriate method. The volume of the data is also increasing: therefore, we need methods that can scale up to hundreds of thousands or millions of cells.
Leave a Reply
You must be logged in to post a comment.

