COVID Data Visualisation
- 11th June 2020
- Posted by: Breige McBride
- Category: News
No Comments
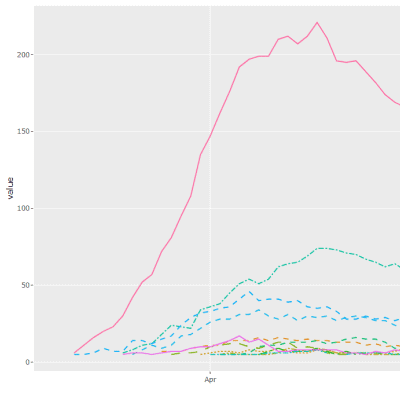
Written in R using the Shiny package, the COVID data visualisation app allows users to dive deeper into the public data released daily, with clear visualisations and plots.
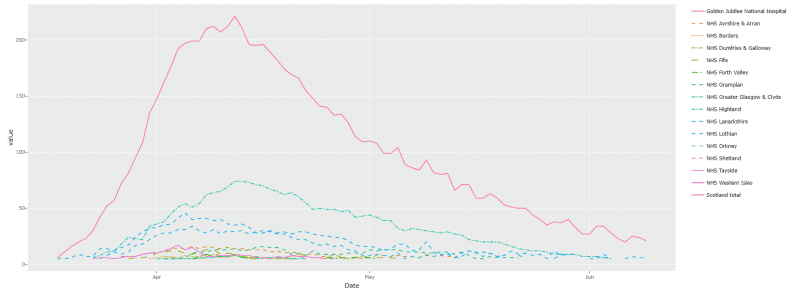
Jack’s easy-to-use app aims to make it simple for the public to look further into national and regional datasets.
“It makes people a little bit more interested in how the pandemic is unfolding.”
Watch our short interview with Jack about the app, below.
COVID Data Visualisation Interview
You can find Jack’s app here.
Data comes from the Scottish Government website on a daily basis.
You may also be interested in:
Exploring changes in gene expression and associated biological pathways in individuals with COVID-19
Fios genomics on YouTube
Drug Repurposing: What are the Benefits?
Leave a Reply
You must be logged in to post a comment.
