Using bioinformatics to assess novel immuno-oncology therapies
- 16th January 2023
- Posted by: Gema Romero
- Category: Gene Expression Analysis
In this post we demonstrate how bioinformatics analysis is beneficial for the assessment of novel immuno-oncology therapies by examining novel immuno-oncology drug combinations in syngeneic mouse models. We examine the effects of the drug combinations by applying bioinformatics analysis to gene expression data sets.
After tumour cell implantation, the mouse models receive a treatment course of either anti-PD1, anti-CTLA4, their combination, or a vehicle control. Tumour biopsies were then taken at day 9 and gene expression was profiled. The data then supplied to Fios Genomics was ultrasonographic measurements of the tumours in situ, over the treatment time course. Gene expression data taken at the final time point was also supplied.
Hypothesis-less bioinformatics analysis
For this project, our first data analysis step is an unsupervised hypothesis-less analysis. This allows us to approach the analysis without any prior ideas about what we are expecting to find. After this, we perform a hypothesis-led analysis. In this study, our hypothesis-led analysis relates to the effect of treatment.
It is important to note that hypothesis-less analysis is a powerful tool for understanding the relationships in our data. In fact, since hypothesis-less analyses tend to focus on visualisation, they often give us a more intuitive picture of what the data is telling us, than formal statistical tests do.
For this project’s hypothesis-less analysis, we use Principal Component Analysis (PCA) to assess the gene expression at the global level. Reassuringly, in the scatter plot of the first 2 principal components below, you can see that the samples from the combination therapy are grouping together:
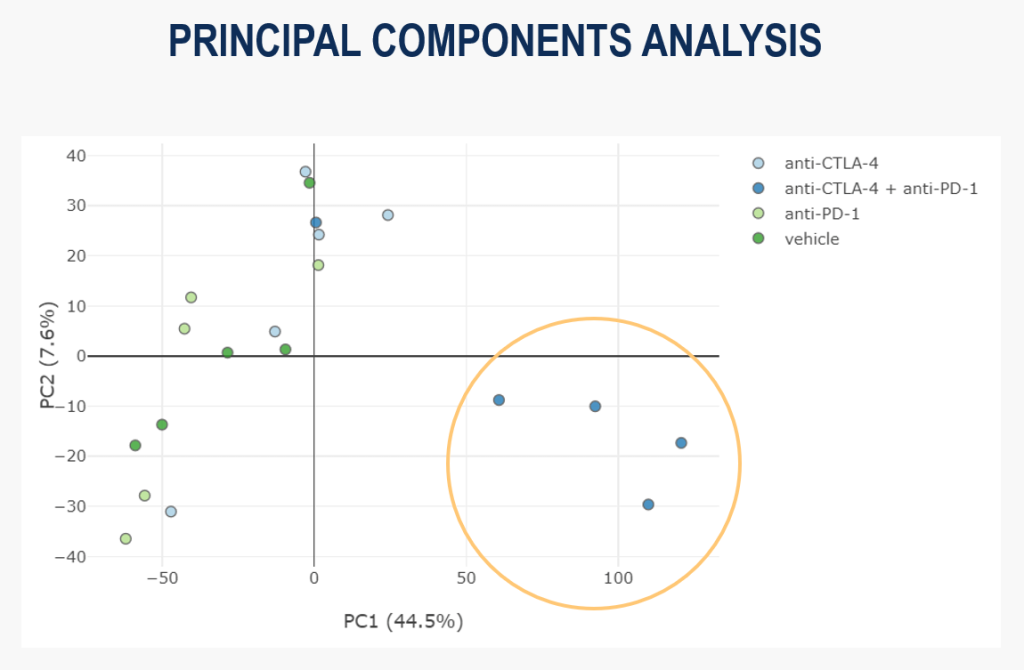
This shows us that there is seemingly meaningful variability in the dataset, suggesting we have a signal we can examine further.
However, we can also see that one combination therapy sample is not clustering with the others, so it seems the effect of treatment is more complex than first appeared.
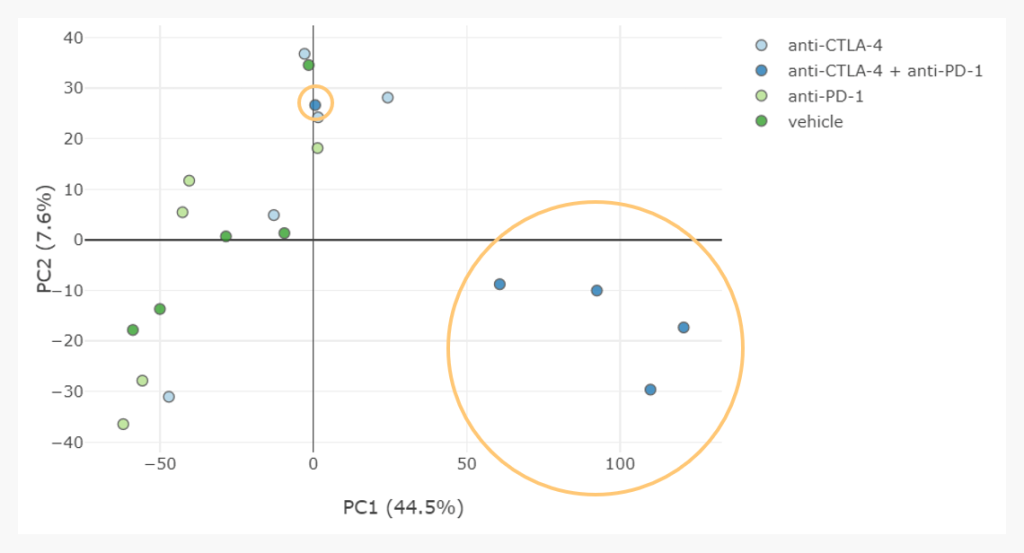
To understand this, our analyst examined tumour volume measurements and determined that this outlier sample came from a mouse which had a delayed reaction to the therapy. Therefore, this sample may have grouped with the others if gene expression had been profiled a few days later.
Thinking along these lines, we can also hypothesise from this scatter plot that perhaps anti-CTLA4 has a similar effect as the combination therapy, but it is delayed. Open minded “no-wrong-answers” thinking like this, triggered by an unsupervised hypothesis-less analysis, are invaluable to generate new hypotheses, suggesting future studies and informing a bioinformatician’s analysis approach.
Hypothesis-led bioinformatics analysis
The data-driven approach
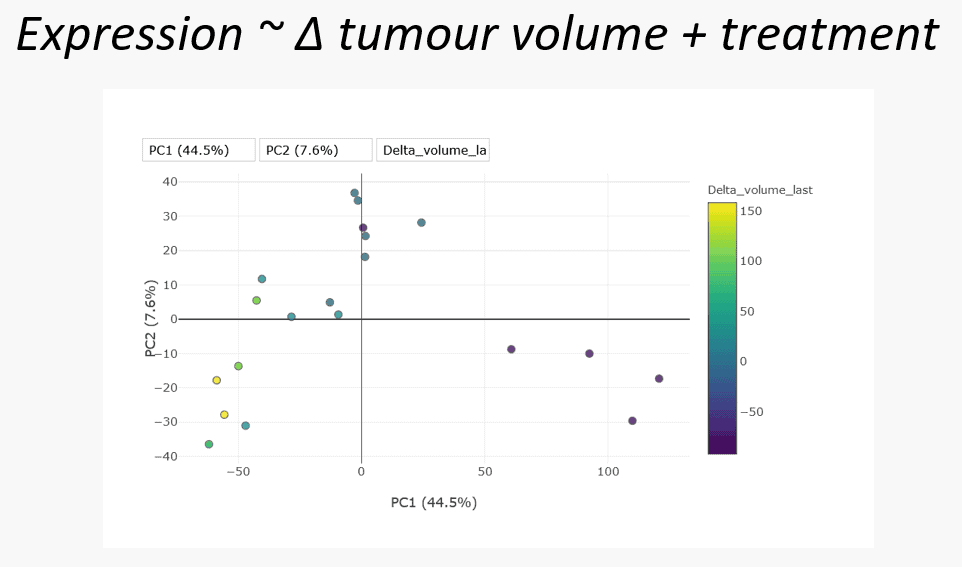
After the hypothesis-less analysis our analyst moved on to two supervised hypothesis-led analyses, using data-driven and biology-driven approaches. The data-driven approach examined model gene expression as a function of the change in tumour volume and treatment. This asks the question “what is the effect of treatment at the gene expression level”. Looking again at the PCA, this time colour-coded tumour volume, there does appear to be some association, with the biggest decrease coincident with the combination treated samples.
The differential gene expression analysis conducted generated a long list of results for each feature in our dataset. Any of these results can be interrogated for meaning and it is up to domain-experts to make sense of the results. One approach is to summarise granular feature-level information to a less numerous and more general form, such as a set of pathways. This process allows the pooling of information across features. Such pooling of information can reveal that while individual features of a particular gene set or pathway may only have weak associations with the phenotype of interest, pooled together their consistency is highly meaningful.
Want to speed up your oncology research with bioinformatics?
The biology-driven approach
When conducting a biology-driven data analysis, our bioinformaticians apply previous domain knowledge to novel data. For this project our analyst used the 16 immunological gene sets as defined by Tamborero et al.1 Using these gene signatures, our analyst applied gene set variation analysis to determine which are enriched within our data.
First the samples were ordered by the change in tumour volume and annotated with their treatment to facilitate visual interpretation. Then the analyst calculated a per-sample enrichment score for each gene set. Negative enrichment indicates that a gene set is inactive in a sample. On the other hand, positive enrichment suggests a gene set is actively being expressed.
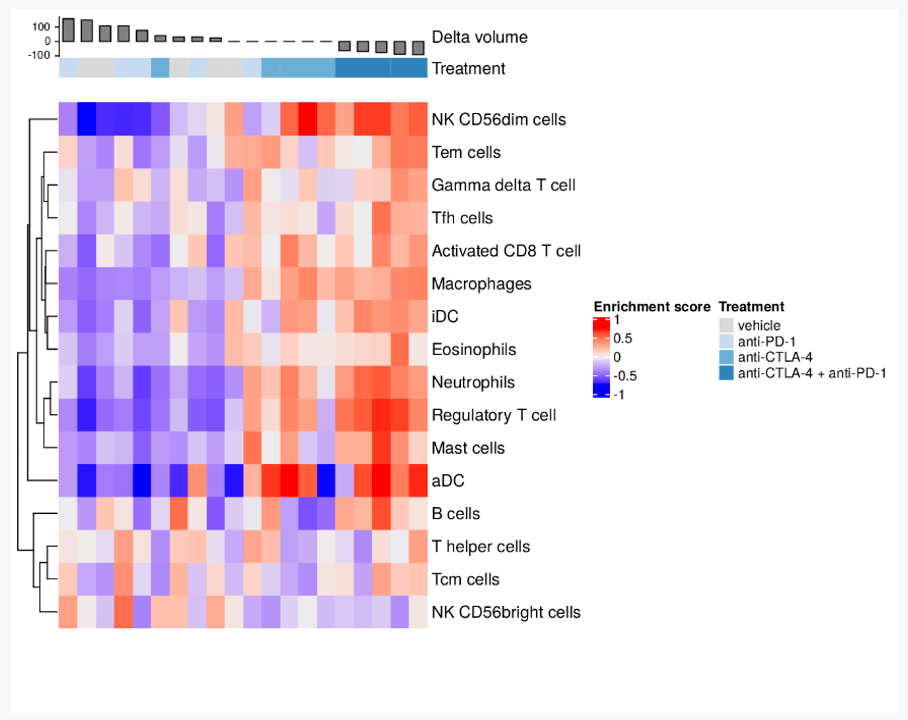
This gene set variation analysis shows us the immunologic landscape of these samples, and their relationship with tumour volume reduction. We can see a clear distinction between growing tumours and stationary or shrinking tumours. There also appears to be further evidence of similarity between the results of the combination therapy and anti-CTLA4 monotherapy.
This walk-through of the analyses performed for this project demonstrates the value of bioinformatics analysis of gene expression data sets. Clearly, such analyses provide important insights into the mode of action and model responses to immune-oncology drugs.
To learn more about our gene expression analysis service, please contact us. We are always happy to discuss new projects and suggest the most suitable analyses to help answer your research question.
Common question about these type of analyses
Q: How do you estimate the sample size necessary to detect a given effect?
A: We can estimate sample size via a power calculation, which comes down to the following individual components:
- An observable effect size (this could be gene expression fold change, for example)
- A significance level, typically 0.05
- “Power” itself, which defines how likely we are to see a result if one is truly there
- Sample size (in this case, what we are trying to find).
We can feed any 3 of these quantities into our power calculation to solve for the 4th. Therefore, to estimate the required number of samples necessary to detect a given effect at a given power at a given significance threshold, we need to input some values.
However, determining values can be complex as we need to draw from previous research or else some convention.
1 https://pubmed.ncbi.nlm.nih.gov/29666300/
See Also
Gene Expression Analysis from Fios Genomics
How Bioinformatics Can Support Your Clinical Trial
Fios Genomics on YouTube
Bioinformatics and the Pharmaceutical Industry
Request a sample of our data analysis reports for oncology
Our team has created a sample report based on data published from a study from Genentech, Inc. that Fios Genomics has been involved in. This study, investigating response to PD-L1 blockade therapies in patients with metastatic urothelial cancers, has been published in Nature (Mariathasan et al. Nature 2018).
The report presents a portion of the published analysis above concerning overall survival and response to treatment. We highlight the ability of high-throughput approaches to define biomarkers which accurately predict both treatment response to anti-PD-L1 therapy and overall survival in patients with metastatic urothelial cancer.
Leave a Reply
You must be logged in to post a comment.
