How to identify biomarkers associated with gene dependency
- 30th November 2022
- Posted by: Breige McBride
- Categories: Biomarkers, Oncology
Wondering how bioinformatics analysis can help you identify biomarkers associated with gene dependency? Then you are in the right place. Here we demonstrate how to do so by walking through one of our publicly available bioinformatics analysis reports. This report aims to identify transcriptional, copy number, and mutational changes associated with BRAF dependency in a range of cancer cell lines.
Data sources for this biomarker identification project
In order to identify biomarkers associated with BRAF-dependent cell lines we first looked at data from the Cancer Cell Line Encyclopedia (CCLE). The CCLE database contains omics data for over 1000 cancer cell lines. In this project, we use CCLE data for 340 cell lines covering six different cancer types: skin, ovary, colorectal, bile duct, as well as CNS and lung. We then extract gene expression, mutation and copy number data for these cell lines before integrating this data with BRAF dependency data from Project Achilles. Project Achilles is a public perturbation data set that systematically knocks down thousands of genes using CRISPR in many of the CCLE cell lines.
By labelling cell lines as either sensitive or non-sensitive to BRAF knockout, based on the dependency score from Project Achilles, we can test for genes and pathways that are associated with BRAF sensitivity in each of the six cancer types.
Meta Data Assessment
Once we have our data, our first step is to assess the meta data. We assess the meta data for each of the cell lines to ensure there is no confounding of the meta data variables. This is important as confounding could lead to scrupulous results in our association tests. Fortunately, there was no confounding that was cause for concern in this case.
We then dichotomised the cell lines using their CERES scores, which indicate the essentiality of BRAF in a given cell line. A cell line with a score >-0.5 is classified as highly sensitive, indicating that BRAF is an essential gene. On the other hand, a score of <-0.5 is classed as low sensitivity, indicating BRAF is non-essential in that particular cell line.
| Lineage | High Sensitivity | Low Sensitivity | Total |
| Skin cancer | 40 | 16 | 56 |
| Ovarian cancer | 4 | 39 | 43 |
| Colorectal cancer | 9 | 28 | 37 |
| Bile duct | 5 | 26 | 31 |
| CNS cancer | 4 | 57 | 61 |
| Lung cancer | 3 | 109 | 112 |
Once we have dichotomised the cell lines into the 2 sensitivity groups, we can see there is a large imbalance in the lung cancer and ovarian cancer indications, as show in the table above. This is due to the homogenous nature of cell lines. Therefore, if a few ovarian cancer cell lines are non-sensitive, it is likely that the majority will be as well.
Quality Control
We then perform a thorough quality control check on the data from each cell line. At this stage, we provide summary plots that might reveal structure not shown by the metadata, or show up strong outliers in the data set.
Since we are using publicly available data from the CLLE database, the expression data had already been aligned to reference and gene counts called. When using publicly available data it is unusual to detect issues with quality due to the stringent quality control measures in place within public databases.
Bulk RNA Statistical Analysis
After quality control, we perform 6 statistical comparisons within each of the omics data types, comparing high vs low samples within each indication.
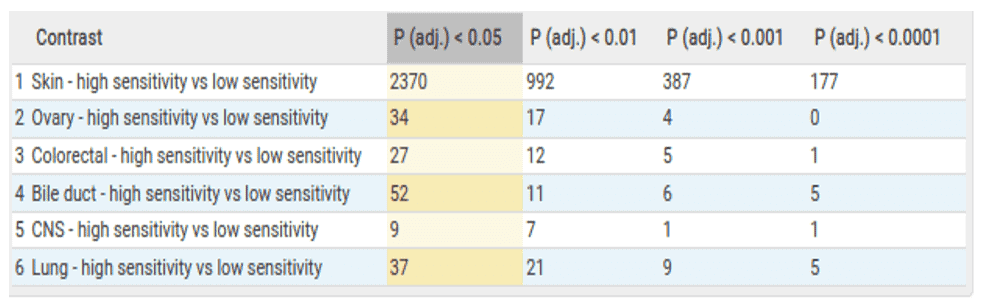
The table below is an overview of the results from the comparisons made within the bulk RNA sequencing data. Here we can see that over 2000 genes are differentially expressed within the skin cancer samples. This is unsurprising as BRAF is a known proto onco-gene within skin cancer. Therefore, we expect to see many genes associated with its essentiality.
In addition to comparisons within indication, we also investigate the overlap of significant genes between indications. We do this in order to assess if there are any pan cancer similarities to BRAF dependency. In this case, we observed NCK2 and TET1 genes are significantly differentially expressed in both the lung and skin cancer comparisons. This indicates a degree of similarity between BRAF dependency across different lineages.
Copy Number Variation Statistical Analysis
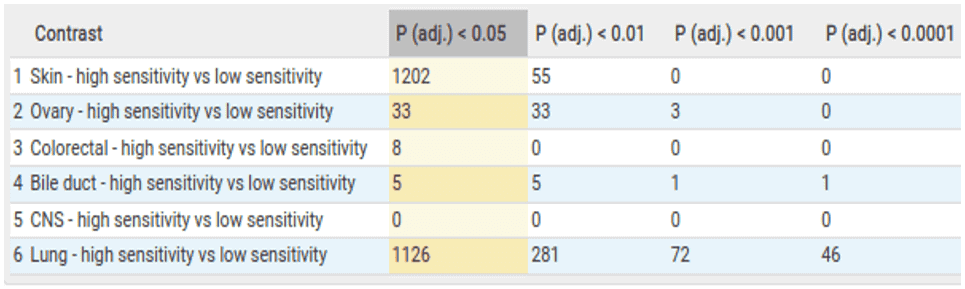
We then perform the same 6 comparisons for the Copy Number Variation (CNV) data. These comparisons show large numbers of copy number differences between high and low-sensitive cells within skin and lung indications.
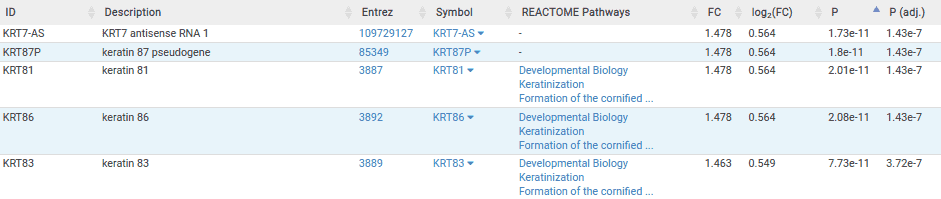
The table below is the results table for the lung comparisons. Here we can see that the top six most significantly associated genes are keratin genes. Since the top 6 most significant genes are keratin genes, this could be a potential biomarker for BRAF sensitivity within lung indications. However, these findings are only based on 3 sensitive cell lines so we would need to perform further studies to validate these results.
While performing the CNV statistical analysis we also look at the overlap of significant genes between comparisons. This shows us that there are 56 overlapping copy number aberrations within the skin and lung comparisons, further indicating a degree of similarity between BRAF dependency across different lineages.
Functional Enrichment Analysis
After the CNV analysis, we perform functional enrichment analysis. This enables us to assess if the genes we have identified as significant in the association tests carry functional relevance. We use hypergeometric tests to ascertain if our significant genes appear more times within a specific Go term or reactome pathway than we would expect by chance.
The bubble plot below shows functional categories that are significantly enriched for genes associated with BRAF sensitivity in skin cancer cell lines.
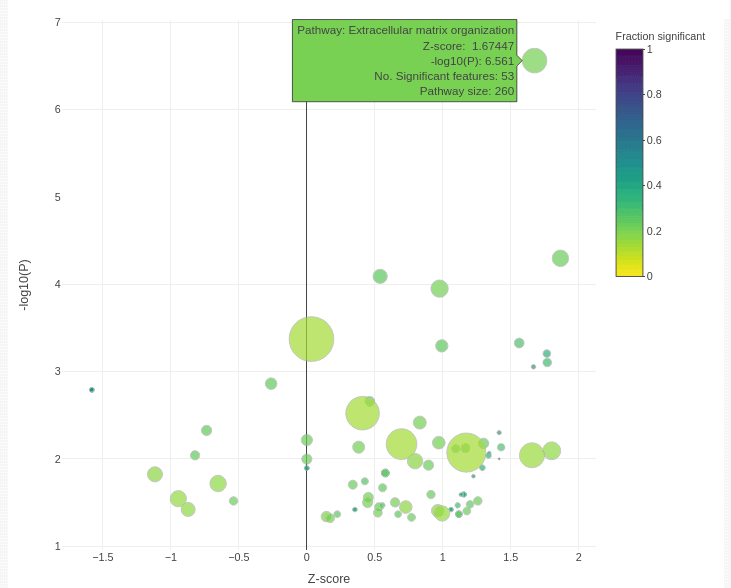
Categories are enriched for up-regulated genes on the right, and down-regulated genes on the left. P values are shown on the y-axis, and the size of point shows the number of genes associated with each category. The colour shows the proportion of genes in the category that are significant in our study, which can be important. For example, 53 extracellular matrix organisation genes are significant in our association test. This is many more than we might expect at random. However, there are 260 genes in the pathway, so the entire pathway is not perturbed. However, we will still likely find real extracellular matrix effects with further investigation.
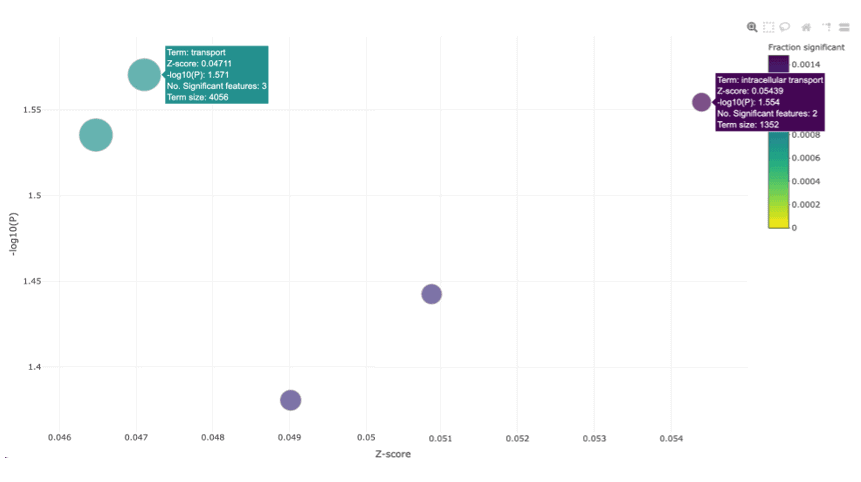
The bubble plot above shows functional categories that are significantly enriched for genes associated with BRAF sensitivity in colorectal cancer cell lines. As BRAF is a member of the RAF kinase family of growth signal transduction protein kinases, and its primary function is to transduce signals from outside the cell to the nucleus to initiate cell differentiation and division, we would expect to see pathways related to transport and intracellular transport, enriched. This reinforces that the sets of genes we identified as significant are functionally relevant.
Conclusions
In this project we identified many genes that are associated with BRAF dependency, particularly within the CNV and bulk RNA sequencing data in the skin cancer indication. This is because BRAF is a known proto-oncogene within skin cancer. We did not detect as many associations within other lineages. This may be due to a lack of any real associations or lack of power in this study to detect them.
The genes identified as significant were enriched in functionally relevant pathways such as signal transduction and intracellular signal transduction.
You can learn more about this biomarker identification project and view all results in our public report which you can request here. You can also view a video walk-through of our report here.
Whether you have gene sensitivity data sets generated in-house or from the public domain, Fios Genomics can rigorously interrogate these for you to identify biomarkers of interest. Contact us now to discuss your next biomarker identification project.
A common question about this project
Q: Can you integrate all three omics data types, to perform a multi-omics style analysis?
A: Yes we can integrate all 3 omics data types in our congruence analysis. This is where we compare the significantly associated genes across all omics data types to see if there is any overlap. For example, is the same gene associated with BRAF sensitivity in the bulk RNA-seq mutation and copy number data? We attribute P values to the overlap of genes using hypergeometric testing to assess if there are more genes overlapping than we would expect by chance.
See Also
Examples of biomarkers and biomarker data analysis
Bioinformatics solutions for oncology research
The future of genomics
Common steps in Single-Cell RNA-Seq data analysis
The clinical trial diversity problem
Leave a Reply
You must be logged in to post a comment.
